
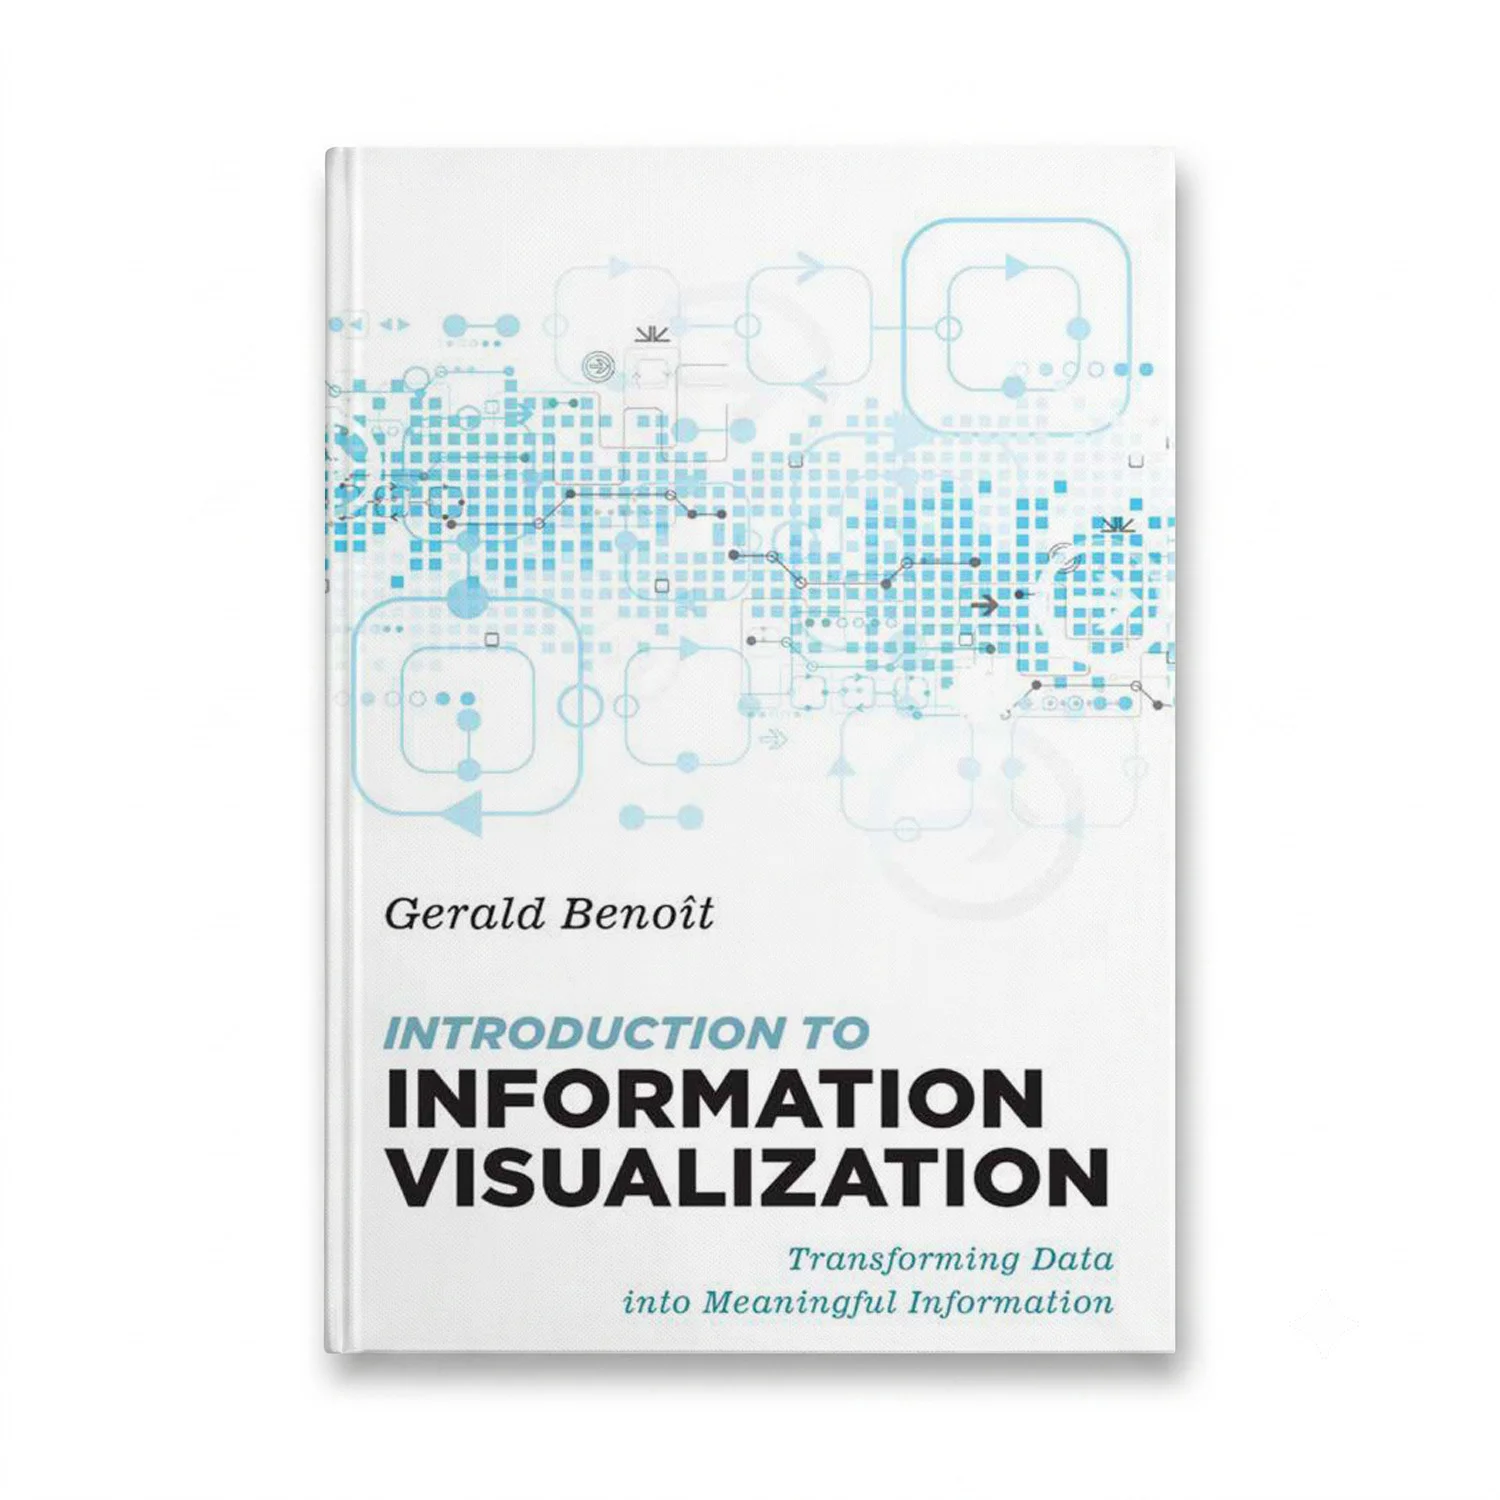

Introduction to Information Visualization: Transforming Data into Meaningful Information by Gerald Benoit delves into the art and science of communicating data effectively. This full-color book, published on February 8, 2019, by Rowman & Littlefield, offers a comprehensive guide for anyone interested in harnessing information visualization techniques across various fields such as research, service, teaching, and professional life.
Designed to be accessible to students from all domains, researchers seeking to enhance their data presentation skills, and professionals looking for continuous learning opportunities, this text bridges theory with practical application. It covers essential topics including HTML5, CSS, and d3.js, providing step-by-step directions on how to apply these tools in real-world scenarios. The book also includes design challenges with fully explained solutions, making it a valuable resource for educators aiming to teach data visualization to scientists or incorporate data principles into humanities curricula.
With a companion website hosting live examples, code samples (JavaScript, d3.js, Python), and a platform for community engagement, the book encourages active participation. It reviews third-party visualization software, trends in big data, and script libraries, offering guidance on how to continue advancing in the field of information visualization post-graduation. The inclusion of partner design labs ensures that readers can apply their newfound skills immediately.
For those eager to explore the future of information and appreciate its aesthetics, this book is a must-read. Whether you are a beginner or an experienced practitioner, Introduction to Information Visualization: Transforming Data into Meaningful Information provides the tools and inspiration needed to transform raw data into meaningful insights.